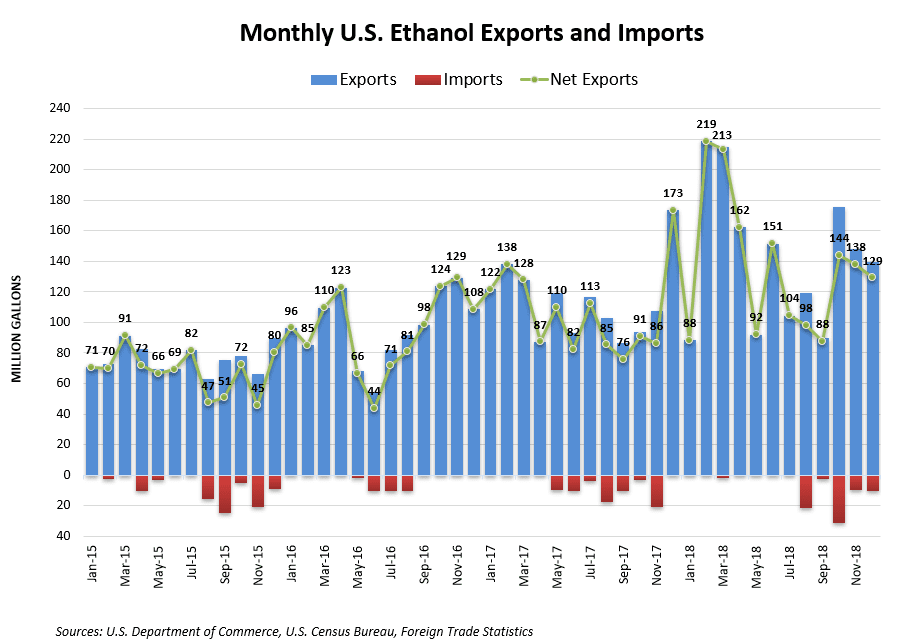
The official numbers are in and they confirm that 2018 was an unprecedented year for U.S. ethanol exports. According to government data released this week and analyzed by the Renewable Fuels Association (RFA), the year ended with December shipments of 139.8 million gallons (mg) of U.S. ethanol.
While December shipments shifted 5.5% lower, the U.S. ethanol export total for 2018 expanded to an unprecedented 1.705 billion gallons—up 24% from 2017, 47% over 2016, and double the export total just four years ago in 2014. This rally parallels recent domestic production expansion, providing an important burgeoning market outside our borders. In fact, nearly one in eleven gallons of ethanol produced in America last year was exported. Brazil and Canada were the leading importers of U.S. ethanol, together receiving half of total shipments. In conjunction with today’s data release, RFA will publish a statistical summary that takes a closer look at 2018 exports.
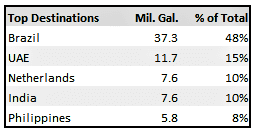
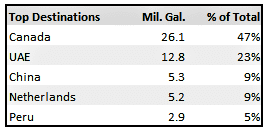
Five destinations accounted for over three-fourths of global shipments of U.S. ethanol in December. Brazil was the top market at 37.3 mg—down 27% from November yet accounting for 27% of U.S. exports. Canada was the second-largest market at 28.1 mg (20% market share), importing 1% less ethanol in December. The United Arab Emirates (UAE) imported its largest volume of the year, with shipments of 68.7 mg accounting for 12% of total U.S. ethanol exports for the month. South Korea doubled its imports at 13.0 mg for a 9% share of the market. The European Union—principally the Netherlands (accounting for 59% of U.S. exports to the EU)—rounds out our largest customers in December with 12.9 mg of U.S. ethanol (9% market share), up 4% from November.
Other significant U.S. export markets in December were India (9.6 mg, down 66% and representing a 7% market share), the Philippines (7.7 mg, up 171% for a 6% market share), Peru (5.3 mg following an absence in November and representing a 4% share), Colombia (2.9 mg, down 14% and representing 2% of the market), and Saudi Arabia (2.2 mg, up 28% for 2% of the market).
Denatured fuel ethanol exports grew 37% in December to 56.1 mg. At 26.1 mg, Canada remained the leading importer of denatured product and accounted for nearly half (47%) of global shipments for the month. December export sales of undenatured fuel ethanol hit 77.4 mg, contracting 14% from November. Brazil again purchased roughly half (48%) of U.S. undenatured fuel shipments (37.3 mg). Worldwide sales of ethanol for non-fuel, non-beverage purposes decreased 62% to 6.2 mg following November’s record high.
The United States imported 10.7 mg of fuel ethanol from Brazil in December, up 8%. As a result, the United States saw a total of 77.6 mg enter its borders last year, with nearly every drop coming from Brazil. Imports have averaged just 73 mg annually over the past five years.
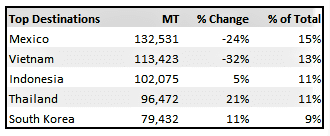
Exports of dried distillers grains with solubles (DDGS)—the animal feed co-product generated by dry mill ethanol plants—eased 12% in December to 890,491 metric tons (mt) for a ten-month low. Mexico remained our top customer, retaining that title every month since overtaking China in Oct. 2016.
The United States shipped a total of 11.88 mmt of distillers grains in 2018. This represents the largest annual volume of DDGS exports in three years and the second-largest on record. Mexico was our top customer—responsible for 17% of annual U.S. export sales—followed by Vietnam (11%), South Korea (10%), Thailand (9%), Turkey (7%), Indonesia (7%), and Canada (6%). The remaining third of U.S. DDGS exported last year was distributed among 43 countries.
A copy of RFA’s 2018 Exports and Imports Statistical Summary is available here.