
Annual Ethanol Production
See the latest stats and facts
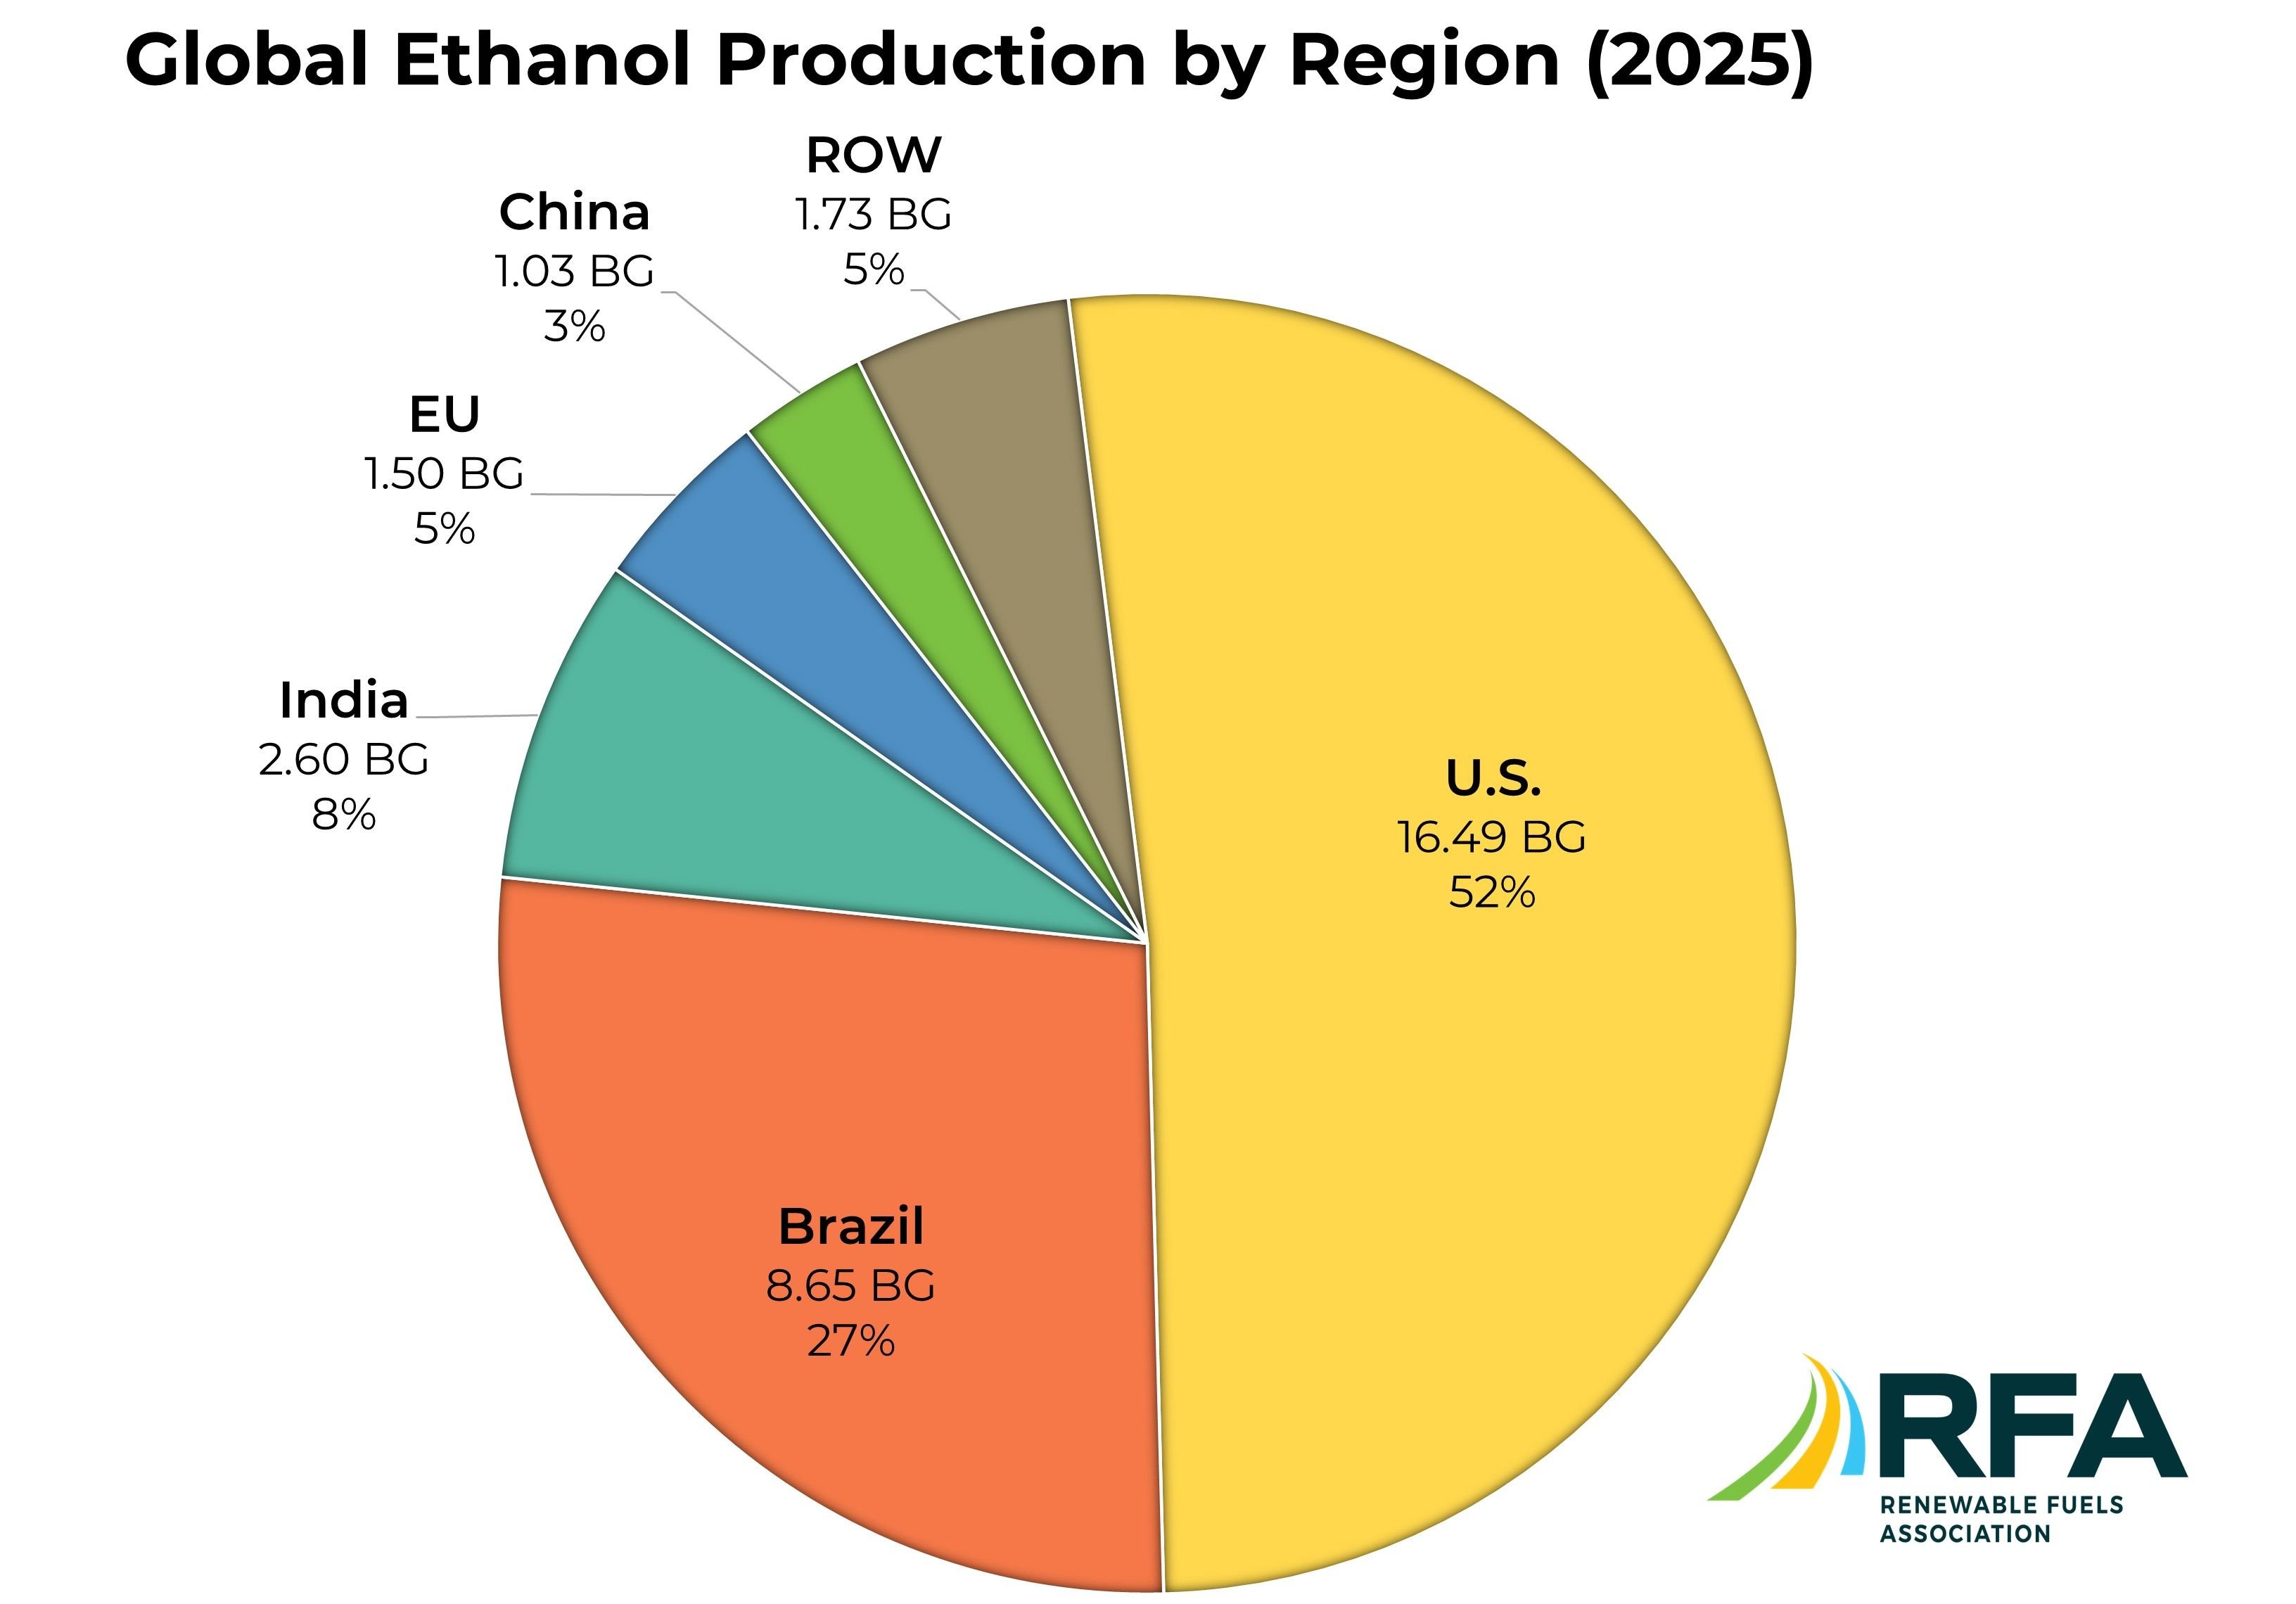
Annual World Fuel Ethanol Production (Mil. Gal.)
| Region | 2021 | 2022 | 2023 | 2024 | 2025 | % of World Production |
|---|---|---|---|---|---|---|
| United States | 15,016 | 15,361 | 15,580 | 16,225 | 16,494 | 52% |
| Brazil | 7,240 | 7,400 | 8,610 | 8,980 | 8,650 | 27% |
| India | 830 | 1,020 | 1,420 | 1,840 | 2,600 | 8% |
| European Union | 1,380 | 1,430 | 1,410 | 1,480 | 1,500 | 5% |
| China | 900 | 960 | 1,070 | 1,170 | 1,030 | 3% |
| Canada | 434 | 447 | 454 | 464 | 472 | 1% |
| Thailand | 350 | 380 | 360 | 360 | 390 | 1% |
| Argentina | 270 | 310 | 310 | 310 | 330 | 1% |
| Rest of World | 470 | 482 | 506 | 531 | 534 | 2% |
| Total | 26,890 | 27,790 | 29,720 | 31,360 | 32,000 |
*Source: RFA analysis of public and private data sources
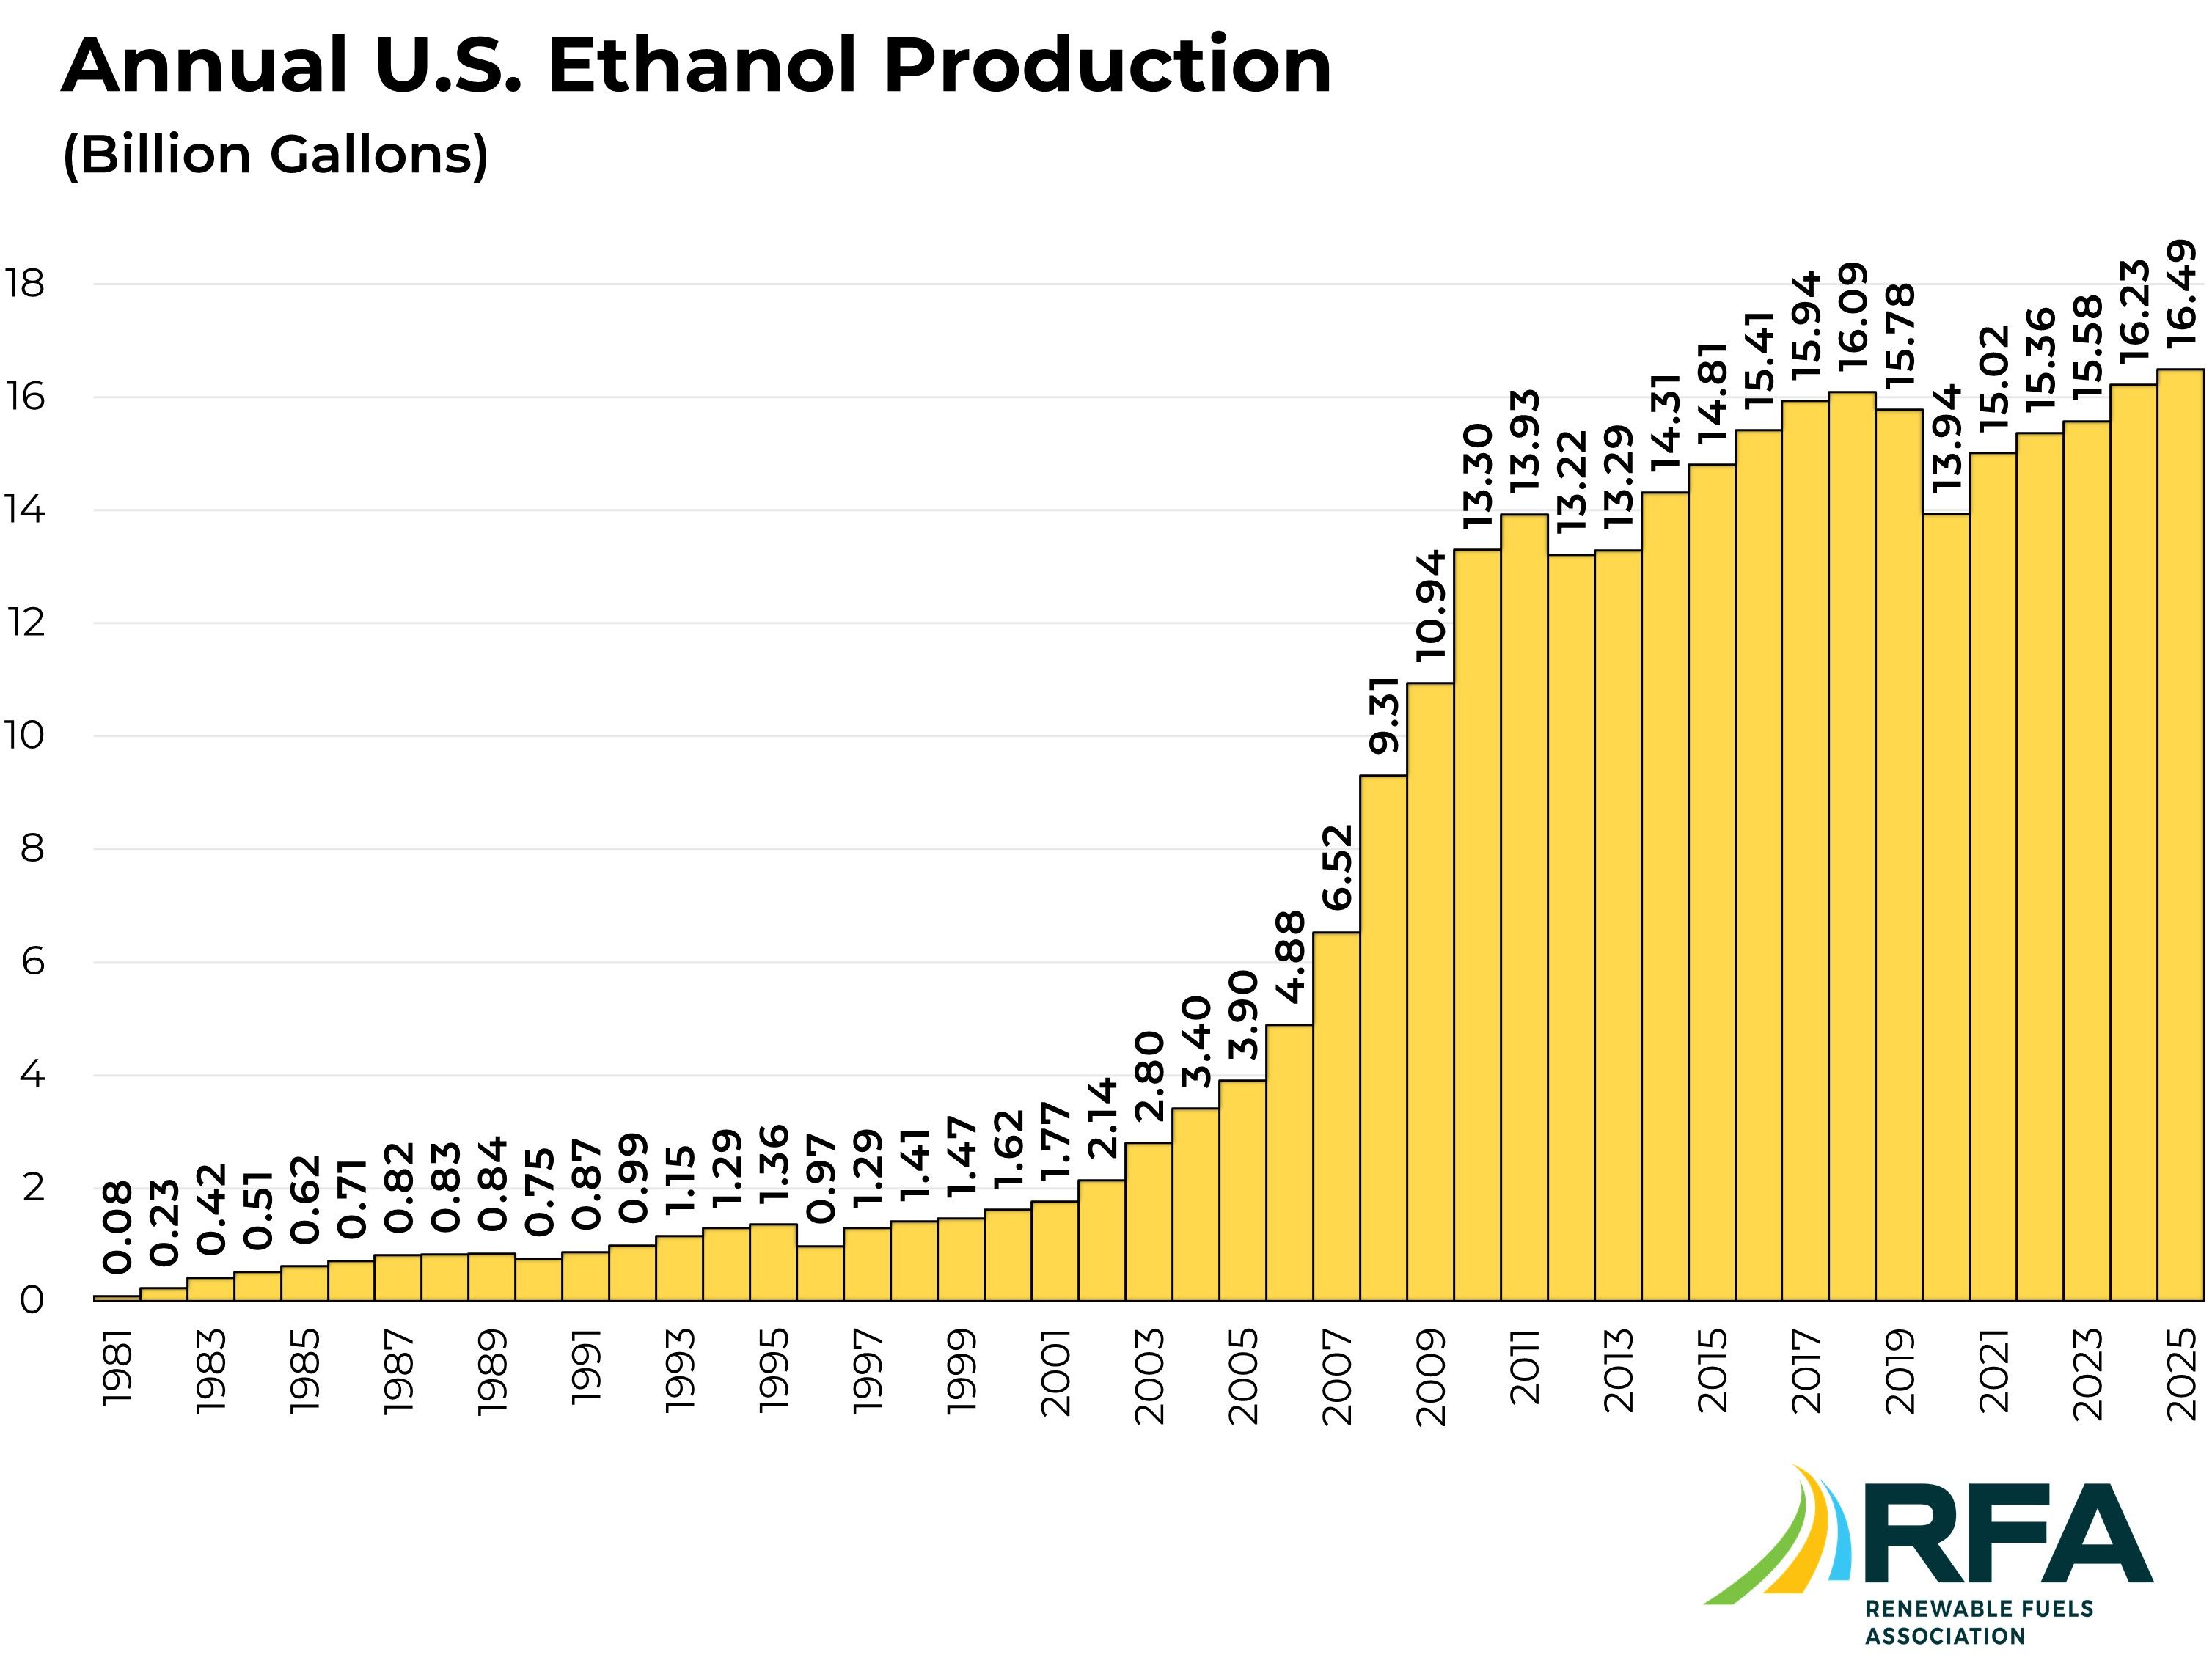
Annual U.S. Fuel Ethanol Production
| Year | Million Gallons |
|---|---|
| 2015 | 14,807 |
| 2016 | 15,413 |
| 2017 | 15,936 |
| 2018 | 16,091 |
| 2019 | 15,778 |
| 2020 | 13,941 |
| 2021 | 15,016 |
| 2022 | 15,361 |
| 2023 | 15,580 |
| 2024 | 16,225 |
| 2025 | 16,494 |
*Source: U.S. Energy Information Administration
