
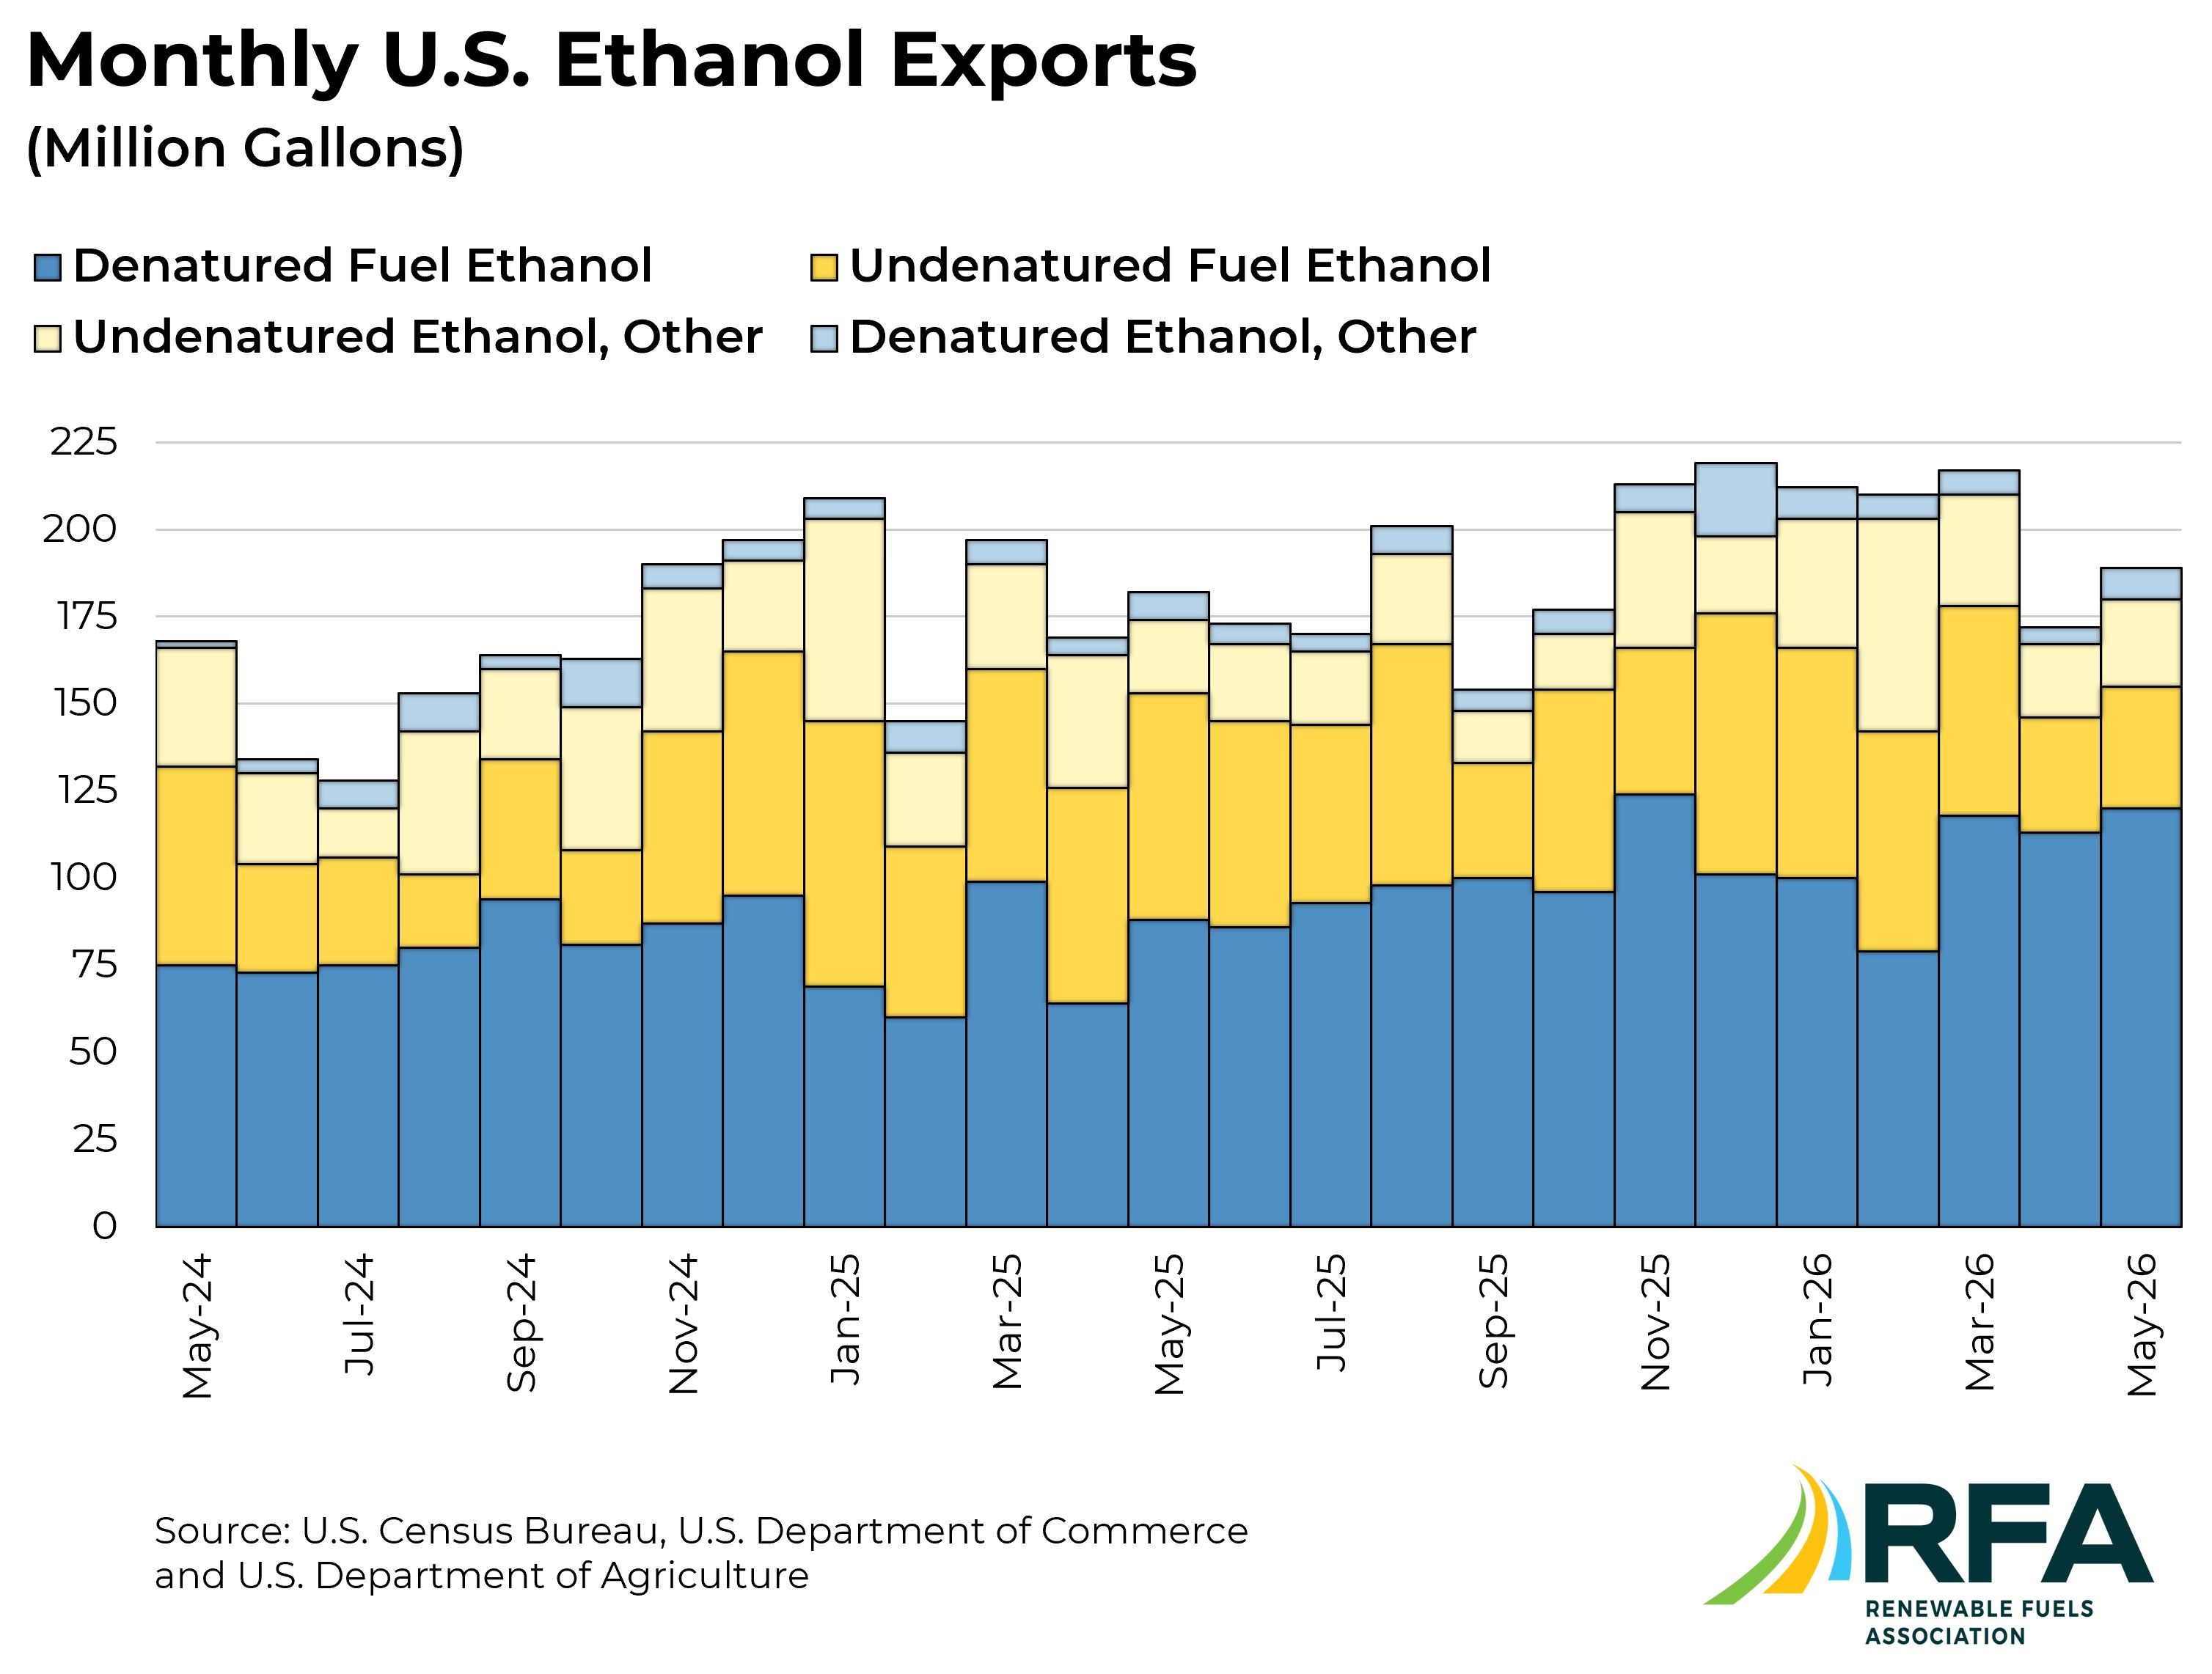
Monthly U.S. Ethanol Exports (Gal.)
| Month | Undenatured, Non-Beverage, Non-Fuel Use | Denatured, Non-Fuel Use | Undenatured, Fuel Use | Denatured, Fuel Use | Total |
|---|---|---|---|---|---|
| May-2025 | 18,232,132 | 9,004,237 | 77,251,231 | 80,183,034 | 184,670,634 |
| Jun-2025 | 29,459,054 | 5,985,470 | 52,221,719 | 86,007,546 | 173,673,790 |
| Jul-2025 | 12,323,849 | 6,400,233 | 58,959,856 | 86,694,440 | 164,378,378 |
| Aug-2025 | 27,706,923 | 8,224,115 | 60,784,435 | 92,058,473 | 188,773,946 |
| Sep-2025 | 14,713,560 | 6,537,100 | 33,047,786 | 94,101,802 | 148,400,248 |
| Oct-2025 | 15,549,465 | 6,580,141 | 58,495,556 | 104,406,658 | 185,031,820 |
| Nov-2025 | 49,413,305 | 8,950,580 | 39,405,142 | 113,562,766 | 211,331,793 |
| Dec-2025 | 16,064,066 | 20,968,075 | 84,721,630 | 98,593,704 | 220,347,475 |
| Jan-2026 | 8,945,553 | 37,251,193 | 65,920,043 | 99,954,766 | 212,071,555 |
| Feb-2026 | 6,575,145 | 61,322,775 | 62,666,674 | 79,307,472 | 209,872,066 |
| Mar-2026 | 7,043,102 | 32,379,989 | 59,934,971 | 118,409,435 | 217,767,497 |
| Apr-2026 | 4,665,938 | 20,903,658 | 32,851,930 | 113,199,108 | 171,620,634 |
| May-2026 | 9,444,096 | 25,468,020 | 34,563,624 | 120,176,438 | 189,652,178 |
*Source: U.S. Census Bureau, U.S. Department of Commerce & U.S. Department of Agriculture
Monthly U.S. Ethanol Imports (Gal.)
| Month | Undenatured, Fuel Use | Denatured, Fuel Use | Total |
|---|---|---|---|
| May-2025 | 6,802 | 24,186 | 30,988 |
| Jun-2025 | 21,696 | - | 21,696 |
| Jul-2025 | 121,266 | - | 121,266 |
| Aug-2025 | - | - | - |
| Sep-2025 | 104,169 | - | 104,169 |
| Oct-2025 | - | - | - |
| Nov-2025 | 19,443 | - | 19,443 |
| Dec-2025 | - | - | - |
| Jan-2026 | 6,229 | 52,824 | 59,053 |
| Feb-2026 | 126,902 | 11,761 | 138,663 |
| Mar-2026 | - | 5,511 | 5,511 |
| Apr-2026 | - | 2,092 | 2,092 |
| May-2026 | 191,566 | 65,235 | 256,801 |
*Source: U.S. Census Bureau, U.S. Department of Commerce & U.S. Department of Agriculture
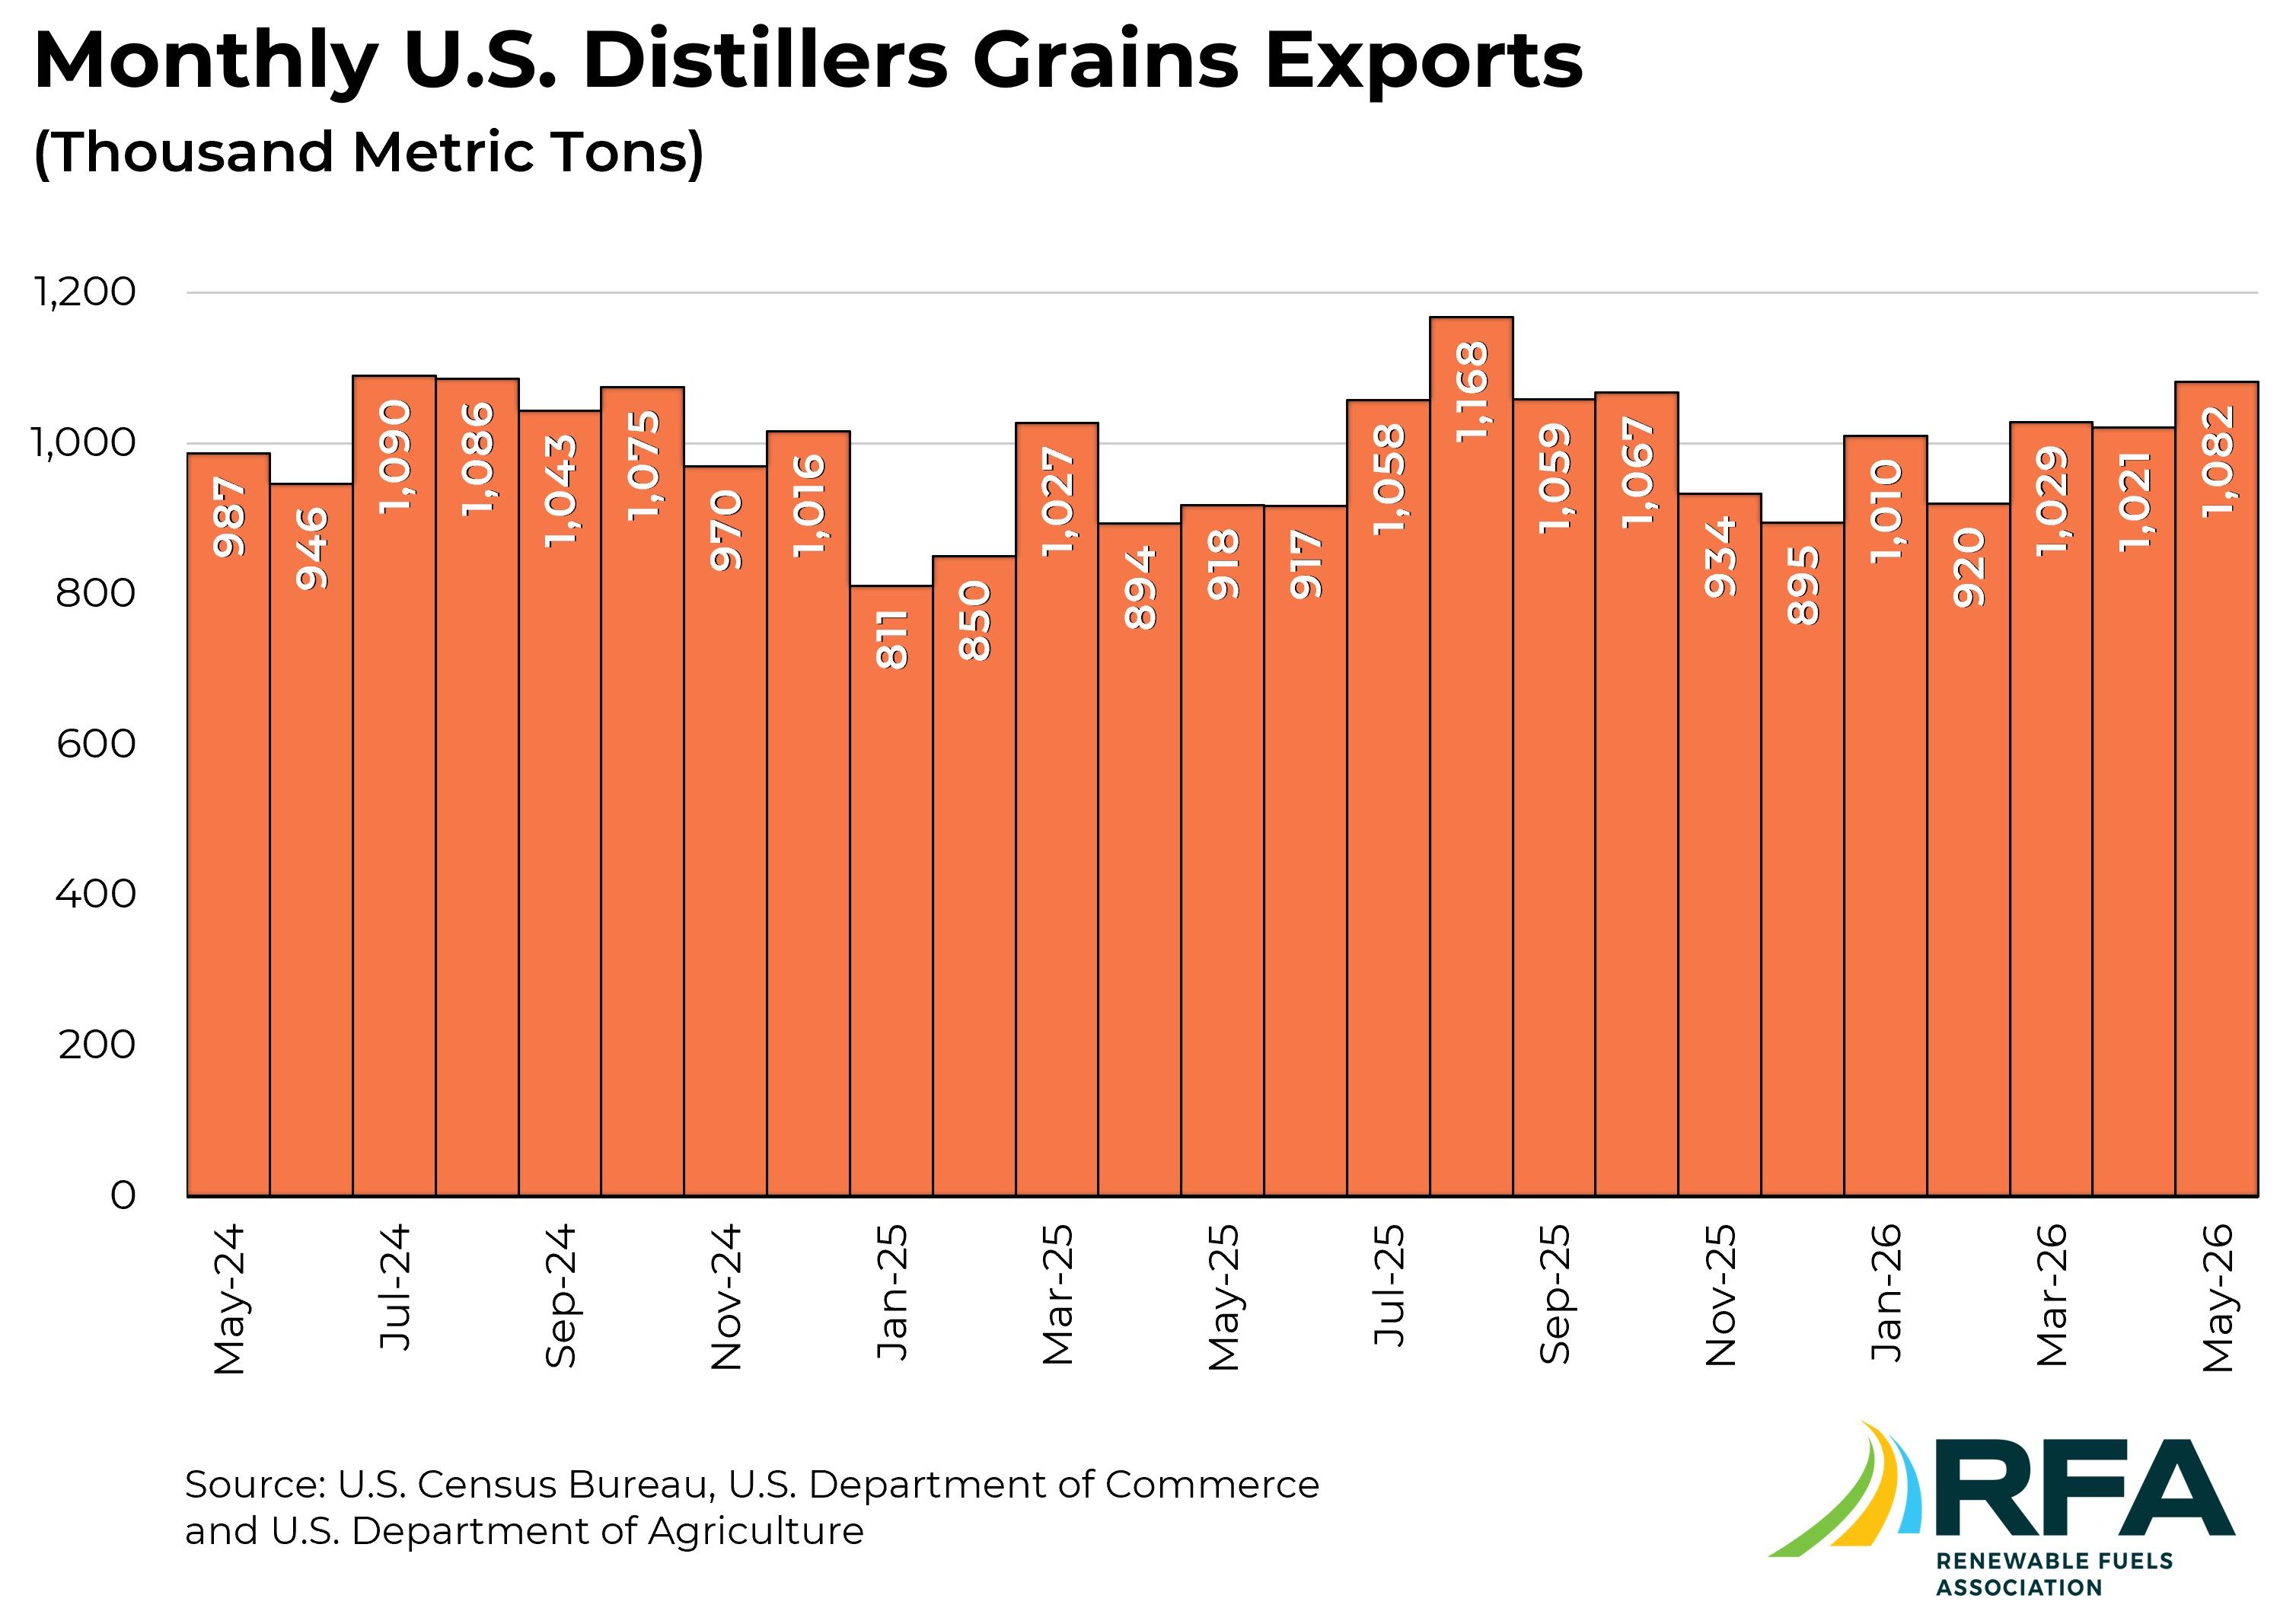
Monthly U.S. Distillers Grains Exports (Metric Tons)
| Month | Total Name |
|---|---|
| May-2025 | 918,108 |
| Jun-2025 | 917,307 |
| Jul-2025 | 1,057,806 |
| Aug-2025 | 1,167,603 |
| Sep-2025 | 1,058,857 |
| Oct-2025 | 1,067,246 |
| Nov-2025 | 933,557 |
| Dec-2025 | 894,665 |
| Jan-2026 | 1,010,346 |
| Feb-2026 | 919,855 |
| Mar-2026 | 1,028,779 |
| Apr-2026 | 1,020,732 |
| May-2026 | 1,081,691 |
*Source: U.S. Census Bureau, U.S. Department of Commerce & U.S. Department of Agriculture
