

The first tranche of data from the 2022 Census of Agriculture was released by USDA on Tuesday, and it showed that the amount of cropland in the U.S. fell by 14 million acres (4%) since 2017, continuing a downward trend that has been in place for more than 50 years.
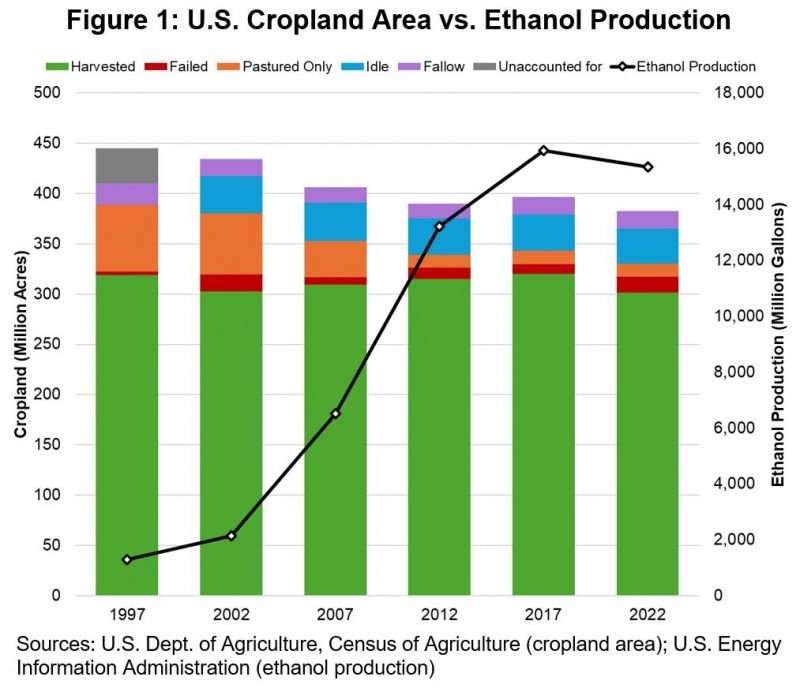
It appears that some environmental organizations would be pleased to see cropland shrink. Recently, they have been hyper-focused on “land use change,” concerned about alleged past expansion of the area on which crops are produced. They tend to attribute the change solely to biofuels—primarily ethanol—ignoring the fact that cropland area fell even as ethanol output increased substantially from the modest volumes of the early 2000s (Figure 1). The debate about land use change is remarkably devoid of discussion of causes other than biofuels, specifically the role of urbanization.
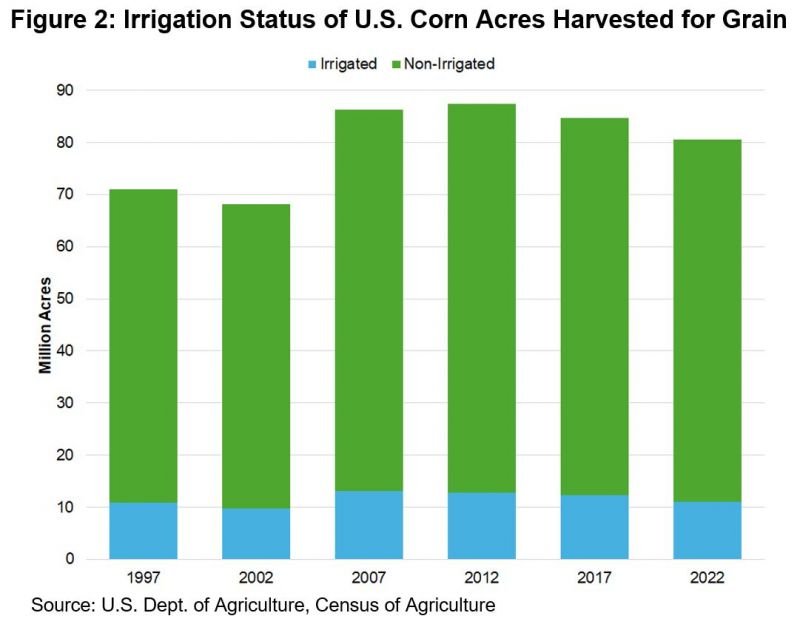
Corn production has expanded over the last few decades, due in part to demand as a feedstock for ethanol. However, it is important to note that from 1997 to 2022, three-quarters of the increase in production was attributable to rising yields, while only one-quarter came from higher acreage, based on Census data. (Moreover, that acreage came from land that shifted out of wheat and cotton production, pasture, and, since 2010, the Conservation Reserve Program.) Notably, according to the Census, the number of irrigated corn acres in 2022 was almost identical to 1997; the additional corn area was nearly entirely non-irrigated (Figure 2).
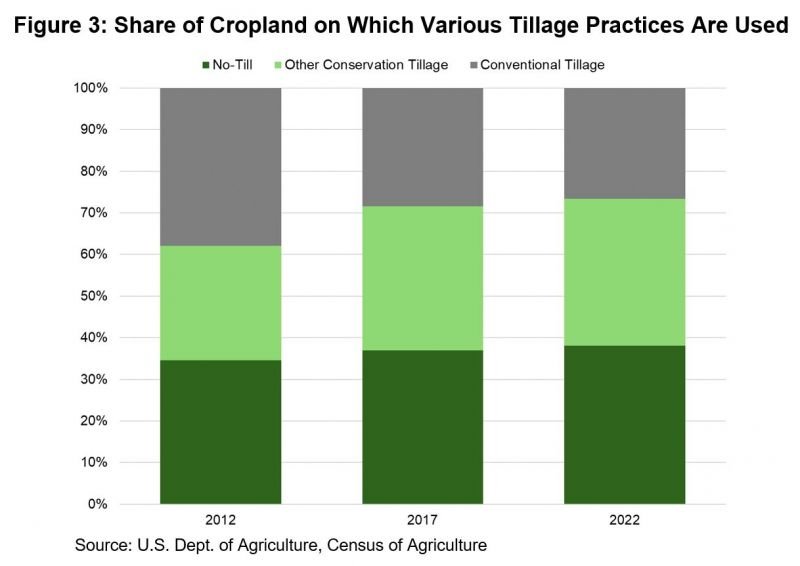
More broadly, growers continued to adopt technologies and practices that reduced their environmental footprint. No-till has increased to 38% of acres for which tillage practices were reported in 2022 compared to 35% in 2012, while other conservation tillage practices grew to 35% from 27% and conventional tillage fell to 27% from 38% (Figure 3). (Comparable statistics have only been reported since 2012.)
Although data are available for a limited timeframe, from 2017 to 2022 the number of acres of cropland that were fertilized, excluding cropland pasture, fell by 5%. The area treated with chemicals declined as well: acres treated to control insects by 26%; acres treated to control weeds, grass, or brush by 10%; and acres treated to control diseases in crops and orchards by 8%.*
Planting cover crops can improve soil health and sequester carbon. Given that awareness of the benefits of cover crops is currently becoming more widespread and that government programs to encourage the practice have only been initiated recently, there are a limited number of acres on which such crops are planted. Still, the 18 million acres of cover crops in 2022 was 17% more than in 2017 and 75% more than in 2012.
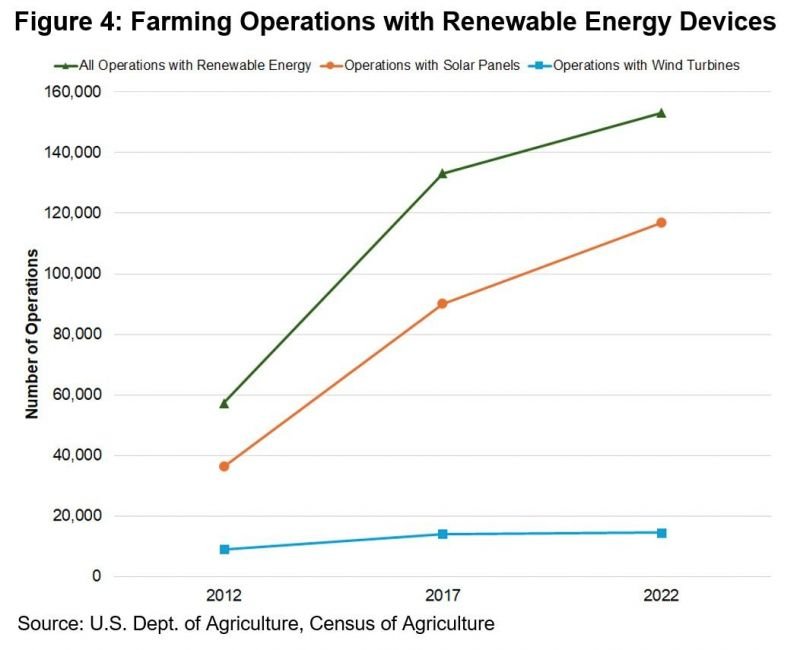
Additionally, many farms are in locations that are highly suitable for the generation of renewable energy. Renewable energy devices were installed on more than 150,000 farming operations in 2022, an increase of 15% since 2017 (Figure 4). The largest share was accounted for by solar panel installations, which were located on nearly 117,000 operations, an increase of 30%. This is notable since the use of renewable energy is one of the means that ethanol production facilities can use to decarbonize.
In summary, the newly released data from the 2022 Census of Agriculture reinforce two trends that have been in place. First, U.S. cropland continues to be vulnerable to loss. Second, producers are becoming more efficient and taking steps to make their operations more environmentally friendly. It’s worth keeping these trends in mind when claims are made about developments on the farm.
# # #
* The number of acres treated to control nematodes increased by 45%, but this involved a substantially smaller area than the other chemical-treatment categories.
